
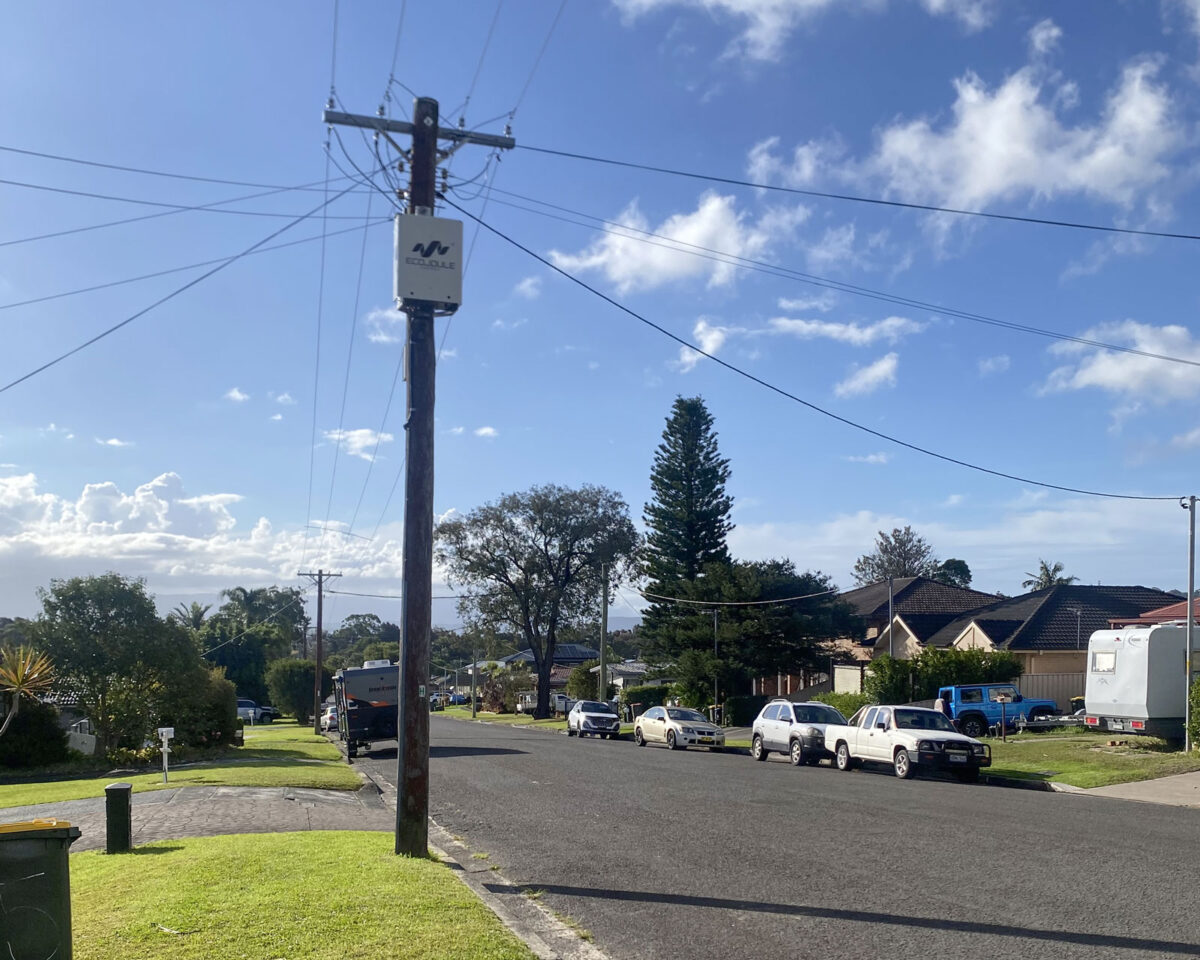
What a connected EcoVAR gives a distribution utility, and how the connection is made.
Most utilities can describe the state of their HV and MV networks in near real time. Below the distribution transformer, the picture thins out. Smart meters report at the point of supply, usually on 15 or 30 minute intervals, and they tell you what a customer connection looked like, not what the feeder was doing between the readings.
An LV STATCOM sits in that gap. It is already measuring the LV feeder continuously, because it has to: voltage, current and harmonic content on each phase are the inputs to its control loop. Whether that measurement stays inside the unit or reaches your planning and operations teams is a decision made at installation, and it costs very little to make the right one.
This article sets out three reasons to connect your LV STATCOMs, and then the practical detail of how it is done on the EcoVAR.
1. Visibility of the LV network
A connected EcoVAR reports three classes of data that most utilities have never held for the LV network at scale.
Voltage. Per phase voltage, as well as STATCOM current, active and reactive power, at the point of installation, at a resolution well beyond metering intervals. Because the EcoVAR is typically installed at the electrical problem, at the end of a long feeder or on a section with heavy solar export, the data comes from the location where your planning assumptions are least reliable. Phase by phase reporting also quantifies imbalance directly, rather than inferring it from connection records that may be decades out of date.
Harmonics. Individual harmonic orders and total distortion, per phase, over time. Harmonic distortion on LV networks is rising with inverter based generation, EV charging and switched mode loads, and most utilities have no ongoing measurement of it. Connected EcoVARs give you a distortion baseline for the sections where you have units installed, and a time series that shows when distortion is worst and how it correlates with load and generation.
Oscillography. Triggered waveform captures around events: voltage dips, transients, and protection operations. This is the class of data that separates a monitoring device from a meter. When a customer reports flicker or equipment damage, a waveform capture from the LV feeder gives an engineer something to analyse rather than something to guess at.
None of this displaces smart metering. It complements it. Smart meters tell you about load profile and customer experience at the connection point. A connected STATCOM tells you about the behaviour of the feeder itself, including reactive power flow and distortion that metering does not report.
The data is available for export into network modelling, digital twin and visualisation platforms. Measured LV voltage and harmonic profiles improve the calibration of LV models that are otherwise built on assumed diversity factors and nominal impedances. For utilities running LV network visibility programmes, connected STATCOMs are an additional measurement layer at sites you were already investing in.
2. Remote adjustment of setpoints and droop curves
An EcoVAR is commissioned with a voltage setpoint and a droop characteristic that suit the feeder as it is understood on the day. Feeders change. Solar penetration increases, EV charging arrives, load transfers occur, and seasonal load composition shifts.
With communications in place, setpoints and droop curves are changed from the office. Without them, every settings change is a truck.
Conservation Voltage Reduction
Conservation Voltage Reduction (CVR) is the deliberate operation of the distribution network toward the lower end of the permitted voltage range in order to reduce energy consumption and peak demand. It works because a meaningful share of connected load is voltage dependent. Resistive heating, some lighting, motors and transformer no load losses all draw less power at lower voltage, and lower voltage also reduces network losses.
The metric used to quantify the effect is the CVR factor: the percentage reduction in demand or energy per one percent reduction in voltage. Published studies commonly report values of about 0.5 to 1.0 for active energy, with higher factors for reactive power and seasonal variation depending on load composition. Utility programmes typically report energy savings in the range of 1 to 4 per cent, achieved without any action by customers.
The constraint on CVR is the low point. A utility can only lower voltage until the worst served customer on the worst feeder reaches the statutory minimum. Everything above that point is headroom the utility cannot use.
This is where LV reactive support and CVR intersect. An EcoVAR clamps the voltage at the new setpoint on the network, controlling the voltage down the LV feeder, not simply at the transformer.
Communications make that relationship manageable. As a CVR programme is tuned, the target voltages at the LV support points need to move with it, seasonally and as the network changes. Doing that remotely across a fleet is straightforward. Doing it with field visits is not.
3. Condition monitoring and evidence led maintenance
The EcoVAR requires no scheduled maintenance. There are no filters to change, no fans to service and no consumables. Stated plainly, that means a time based maintenance programme adds cost without adding reliability.
The alternative is to attend site when the equipment tells you to. A connected fleet reports internal temperatures, converter status, alarm and event history, availability, and the reactive power the unit is actually delivering against what the network is asking of it. That supports three decisions a maintenance planner needs to make:
- Which units, if any, need attention.
- Whether a reported network problem is the STATCOM or the network.
- Whether units are correctly sized and set for the feeders they are on, or whether some are running at their limits while others are barely working.
The third point tends to be the one that changes budgets. Fleet data shows where a unit is under utilised and could be redeployed, and where a feeder has outgrown the support installed on it.
There is a fair objection here. If the equipment is maintenance free, why monitor it? Because maintenance free is a statement about scheduled intervention, not a claim that nothing will ever need attention. Monitoring is what lets you replace a calendar with evidence, and it is also what lets you prove availability to your own asset management function.
How to add communications to an EcoVAR
Physical provisions
Every EcoVAR provides:
- An RJ45 Ethernet data port for the communications device.
- A DC auxiliary supply, nominally 15 V, 15 W, for powering that device.
The utility selects the communications bearer. In practice this is usually a cellular router where no utility network exists at the site, or a connection into an existing utility WAN, fibre or mesh where one does. Because the EcoVAR supplies the router, no separate supply, meter or service connection is required. The communications device is powered from the asset it is monitoring.
Three communications paths
| Path | What it delivers |
| DNP3 | Integration into conventional SCADA and ADMS platforms. LV measurements and status appear in the system your control room already uses, extending SCADA visibility down to individual LV feeders. |
| Modbus | The same SCADA integration for utilities and RTUs standardised on Modbus. For utilities with mature SCADA and established cyber processes, DNP3 or Modbus is usually the path of least resistance. |
| Secure API | Connects the unit to EcoFLEET, the EcoJoule fleet management and configuration platform. EcoFLEET aggregates field performance data across the fleet, provides real time dashboards, and handles remote firmware and settings updates. |
EcoFLEET is normally hosted within the utility environment, under the utility security controls. EcoJoule can host it for utilities that want an additional service layer, and that arrangement is agreed case by case.
The paths are not mutually exclusive. A common arrangement is DNP3 or Modbus into SCADA for operational monitoring and control, with the Secure API to EcoFLEET for engineering data, fleet analytics and firmware management.
What the data lets you find
Connected LV STATCOMs turn a class of LV faults from customer reported into utility detected:
- Harmonic sources. Distortion measured at multiple points identifies which section a source sits on.
- Blown LV fuses and open neutrals. These appear immediately as a phase level anomaly.
- Voltage excursions and flicker. With waveform evidence attached, rather than a description over the phone.
Historically the first indication of most of these was a customer complaint, which means the problem had already persisted long enough for someone to be affected by it, and long enough for the evidence to be gone by the time a crew arrived. A connected EcoVAR reports the condition when it occurs.
The commercial case in one line
The hardware provision is already in the unit. The incremental cost of connecting an EcoVAR is a communications device and its data plan. What you get in return is a settings change that costs nothing instead of a truck, LV data you have not previously been able to buy at this resolution, and a maintenance programme driven by condition rather than calendar.
If you have EcoVARs in service without communications, we can scope the retrofit against your existing units. If you are planning a deployment, the time to specify the communications path is now, while the installation is still on paper.
References on Conservation Voltage Reduction
- US EPA / ENERGY STAR, Voltage Optimisation and CVR: Evaluation, Measurement and Verification Best Practice.
- Diaz-Aguilo et al., Field Validated Load Model for the Analysis of CVR in Distribution Secondary Networks, IEEE Transactions on Power Delivery.
- Padullaparti et al., Conservation Voltage Reduction with DERMS, Grid Edge and Legacy Devices, NREL, 2023.
- Assessment of Conservation Voltage Reduction in Distribution Networks with Voltage Regulating Distribution Transformers, Energies 16(7), 2023.
- Estimation of Conservation Voltage Reduction Factors Using Measurement Data of the KEPCO System, Energies 10(12), 2017.